Can Pipe Flow Expert draw a combined system curve for multiple pumps in series or in parallel?
Drawing a system curve in Pipe Flow Expert
The Pipe Flow Expert software can plot a system curve on the pump graph when the system is solved. The system curve starts from some static head value at zero flow, and runs up and through the operating point of your pump/compressor.
Single Pump
To draw a System Curve through the operating point on the pump graph, the flow versus head performance of the pump must be defined (the software does not currently draw system surves for fixed flow rate or fixed head increase pumps where no pump performance graph exists).
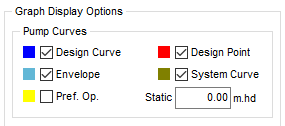
Once the pump’s flow versus head performance curve has been defined, you can open the pump data screen, select open 'Graph Options', and check the box for the system curve.
When you do the above and the system is solved, clicking on the pump in Results Mode will plot and display the system curve going up through the operating point on the pump curve.
Note: If the static head in the system is not zero then you can enter a static head value and the system curve will automatically redraw taking account of this. The software does not automatically calculate a static head because not all systems are single line supply to some discharge point. Where a pipe network has many loops and paths, there is not necessarily a single static head value. A static head in a network would need to refer to a start point and end point, and these would be determined by which section and run of pipes was being considered.
To change the static head, click on the Graph Options button and then enter the Static head under the checkbox for the system curve.
Multiple Pumps
The software does not automatically plot a combined system curve that takes account of multiple pumps.
To plot a combined system curve, the user must first combine the performance of the pump curves manually.
Where a system is simple, it may be possible to combine the performance of multiple pumps into a single pump curve, to allow an overall system curve to be plotted. The combined pump curve data is determined by the configuration of the original pumps, and whether they are in series or whether they are in parallel.
Pumps in parallel
Pumps that run in parallel have a combined pump curve where their flow rates are summed for a given head point on the original curves.
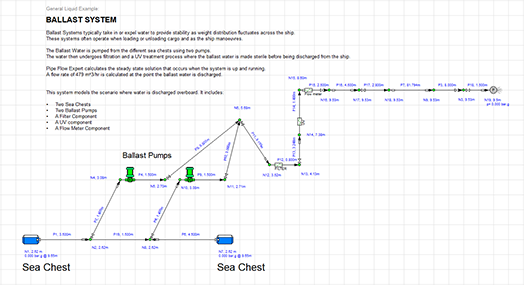
To demonstrate this, we can take a look at Example System General_16_Ballast_Water_Discharge (can be viewed directly within the software). This system contains two identical pumps that act in parallel to pump ballast water from different sea chests, where it eventually discharges from the ship.
The pump performance data for each pump is given below:
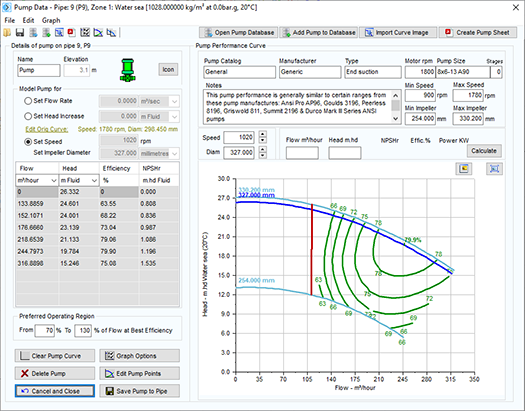
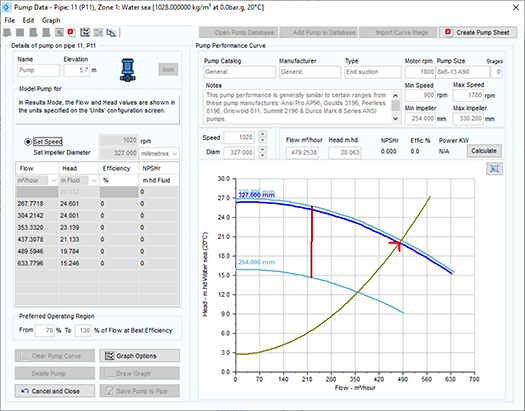
Since these pumps are running in parallel, we can temporarily remove these from the system, and replace them with a new pump on pipe 11 (where the two paths meet) that has a combined performance curve.
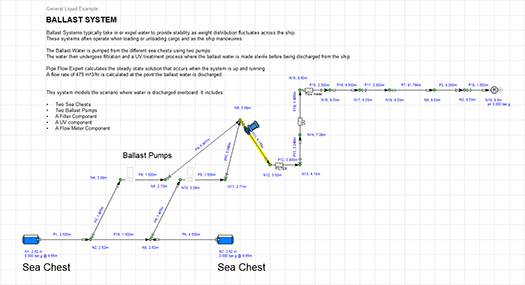
The two pumps are identical, and therefore for the same head values the combined pump data will have double the flow rate. After defining the combined flow versus head performance data for the combined pump, we can check the system curve box in ‘Graph options’ and for this particular system we specify the static head as 2.73m. The system curve will then be plotted though the operating point when the system is solved.
Pumps in Series
Pumps that run in series will have a combined pump performance curve where the individual pump head's are summed for the same flow rate on the original curves.
A similar process to that discussed for parallel pumps, can be carried out to plot the combined system curve for pumps in series. The original pumps can then be temporarily removed and replaced with a new pump that has a combined pump performance curve. This allows the sytem to be solved (with the same results obtained) and a system curve can be plotted on the combined pump curve.
Additional Comments
For some systems, it is useful to plot a system curve so that there is a visual representation of the change in pump head requirement for different flow rates (either less than or greater than the flow rate at the operating point). This allows the engineer to somewhat understand the dynamics of the system under different flow rates, without having to recalculate the results of the whole system, and this was particular useful before computers were avaibale that could instantly recalculate a whole system under different criteria.
With the advent of sophisticated software and instant results, the engineer can easily obtain exact results for different scenarios and therefore does not necessarily need to rely so much on system curves. In addition, with more complex systems containing multiptle loops, multiple supply points, and multiple discharge points, there is not always just one system curve, however the software will provide the engineer with the exact operating conditions of their system under different scenarios, such that they do not need to rely so much on system curves.